HER2 Scoring
Automated HER2 Scoring per ASCO/CAP Guidelines
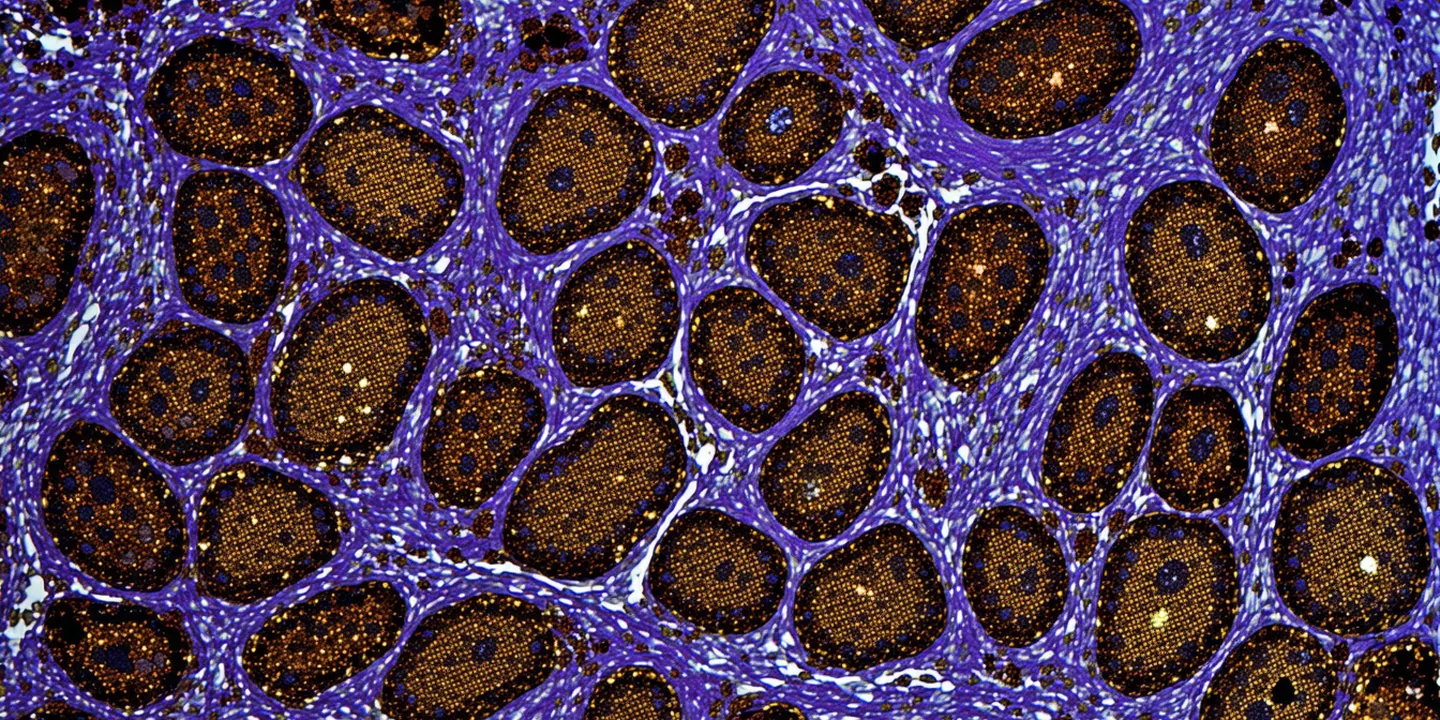
0 to 3+ classification with equivocal case flagging for ISH reflex. Membrane staining intensity quantified at cell-level resolution.
EXAMPLE OUTPUT
HER2_result = {
  "classification": "2+ (Equivocal)",
  "h_score": 94,
  "pct_3plus": 8.2,
  "pct_2plus": 31.7,
  "ish_flag": true,
  "confidence": "High"
}
Scoring System
HER2 0 / 1+ / 2+ / 3+ Classification
Per 2018 ASCO/CAP HER2 Testing Guidelines for breast carcinoma.
| Score | Pattern Description | Synthia Measurement | Clinical Interpretation |
|---|---|---|---|
| 0 | No staining or incomplete faint membranous staining in ≤10% of invasive tumor cells | H-score < 10; <10% cells show any membrane staining | HER2 negative — no targeted therapy indication |
| 1+ | Incomplete faint/barely perceptible membranous staining; staining in >10% of invasive tumor cells | Incomplete/weak membrane signal; H-score 10–54 | HER2 negative — no targeted therapy indication |
| 2+ | Circumferential incomplete and/or weak-to-moderate complete membranous staining in >10% of invasive tumor cells | Moderate membrane intensity or incomplete complete staining; H-score 55–179; ISH flag triggered | HER2 equivocal — reflex ISH testing required per ASCO/CAP |
| 3+ | Circumferential complete and intense membranous staining in >10% of invasive tumor cells | Strong complete circumferential membrane staining; H-score ≥180; ≥10% cells 3+ intensity | HER2 positive — trastuzumab/pertuzumab therapy eligible |
How Synthia Determines Each Grade
Synthia segments each cell nucleus and maps membrane-associated DAB staining to classify staining as complete circumferential (3+), incomplete or weak circumferential (2+/1+), or absent (0). Staining intensity is quantified on a continuous scale using calibrated optical density thresholds derived from pathologist-annotated reference cases.
For 2+ equivocal cases, the system generates both the primary IHC classification and an automated ISH reflex recommendation note — reducing the need for pathologists to remember guideline thresholds for borderline cases.
The output is a full structured report including: overall H-score, percentage of cells at each staining intensity level, spatial heatmap overlay, and the ASCO/CAP classification with confidence interval.
Performance Metrics
HER2 Internal Validation Results
Internal study, data on file. For investigational use only. Performance in your laboratory may vary.
| Metric | Value | 95% CI | Reference Standard |
|---|---|---|---|
| Overall concordance (0/1+/2+/3+) | 91.8% | 89.2–94.1% | 3-reader majority vote |
| Weighted Kappa | 0.89 | 0.86–0.92 | Linear weight |
| ICC (continuous H-score) | 0.94 | 0.92–0.96 | Pathologist H-score estimate |
| Equivocal 2+ rate | 18.4% | — | Per ASCO/CAP expected range |
| Equivocal concordance with consensus | 88.6% | 83.4–92.8% | 2+ identification agreement |
| Test-retest ICC (n=50) | 0.997 | 0.995–0.999 | Same slide, 7-day interval |
Test HER2 Scoring on Your Slides
Submit a de-identified HER2 breast cancer WSI set for a pilot report. Receive scored results and a concordance breakdown within 48 hours.