PD-L1 Scoring
Automated PD-L1 TPS and CPS Scoring
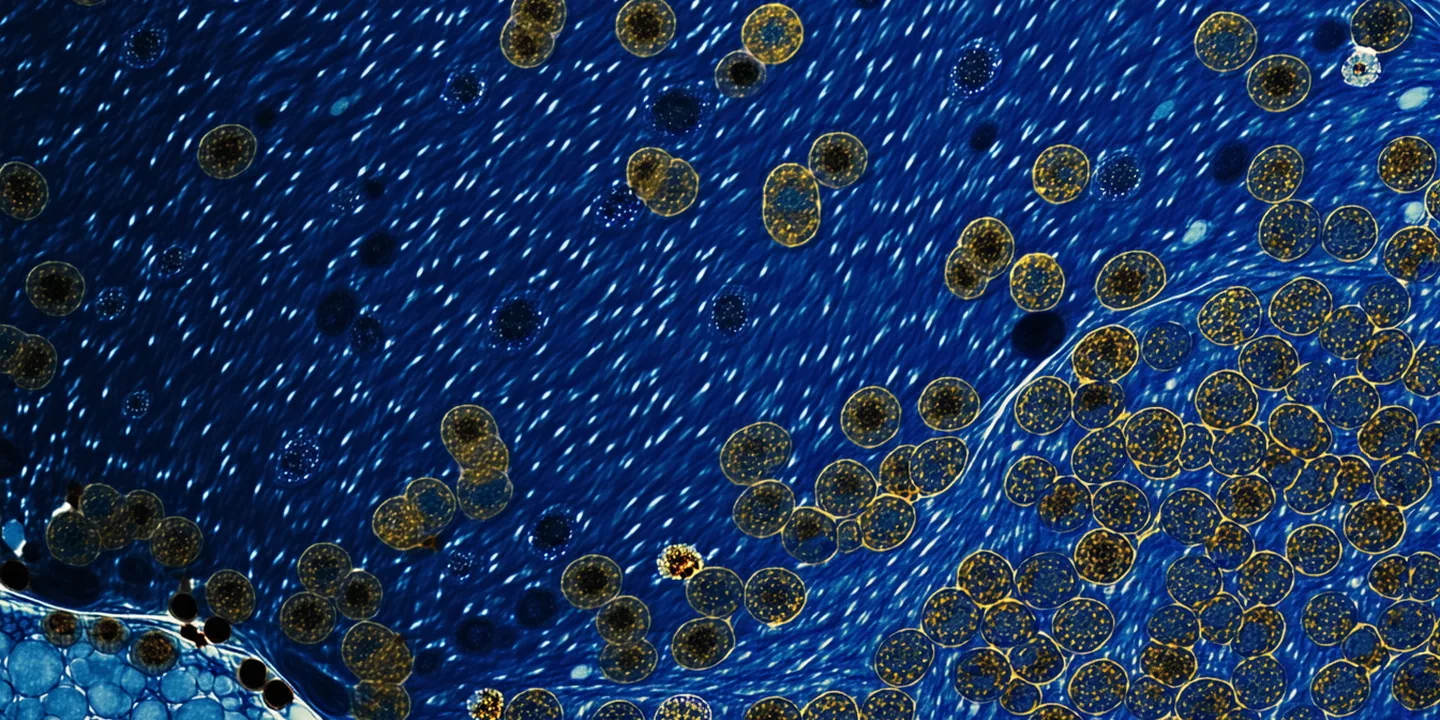
Checkpoint inhibitor eligibility scoring with multi-assay normalization. Tumor proportion score and combined positive score from a single WSI analysis.
EXAMPLE OUTPUT
PD-L1_result = {
  "assay_clone": "22C3",
  "TPS": 38.4,
  "CPS": 12.1,
  "tumor_cells_pos": 842,
  "immune_cells_pos": 167,
  "confidence": "High"
}
Scoring Systems
TPS, CPS, and IC-Score: The PD-L1 Complexity
PD-L1 IHC is uniquely challenging because the clinical threshold depends on which antibody clone, which scoring system, and which tumor type. Synthia handles all three.
| Score Type | Definition | Cells Counted | Common Clinical Use |
|---|---|---|---|
| TPS Tumor Proportion Score |
Percentage of viable tumor cells with partial or complete membrane staining at any intensity | Tumor cells only (excludes immune infiltrate) | NSCLC (pembrolizumab); 22C3 and 28-8 assays |
| CPS Combined Positive Score |
(PD-L1 positive cells — tumor + lymphocytes + macrophages) ÷ total viable tumor cells × 100 | Tumor + immune infiltrate | Gastric/GEJ, cervical, head & neck, TNBC; 22C3 assay |
| IC-Score Immune Cell Score |
Percentage of tumor area covered by PD-L1 positive immune cells | Immune cells within tumor area | Urothelial carcinoma; SP142 assay (atezolizumab) |
Multi-Assay Normalization: 22C3, 28-8, SP142
One of the most clinically relevant complications of PD-L1 testing is that the three major assays — 22C3 (Dako/Agilent, for Keytruda), 28-8 (Dako/Agilent, for Opdivo), and SP142 (Ventana/Roche, for Tecentriq) — are not interchangeable. They use different antibody epitopes, detection systems, and have different clinical thresholds for the same tumor type.
Synthia's PD-L1 module accepts assay metadata at submission and applies assay-specific calibration curves derived from our pathologist-annotated reference sets. The output report specifies: assay clone, scoring method (TPS or CPS), raw count, and the threshold interpretation for the relevant indication.
Our model separates tumor cell staining from immune cell staining using nuclear and cytoplasmic morphology — critical for CPS calculation accuracy in tumors with heavy immune infiltrate.
NSCLC Thresholds (22C3)
Clinical interpretation. Consult oncologist. Synthia output is not a diagnostic report.
Performance Metrics
PD-L1 Internal Validation Results
Internal study, data on file. For investigational use only.
| Metric | Value | 95% CI | Reference Standard |
|---|---|---|---|
| TPS categorical concordance (<1% / 1–49% / ≥50%) | 88.3% | 84.7–91.6% | 3-reader majority vote |
| Weighted Kappa (TPS categories) | 0.88 | 0.84–0.91 | Linear weight |
| ICC (continuous TPS %) | 0.92 | 0.89–0.94 | Pathologist TPS estimate |
| CPS concordance (vs. manual CPS estimate) | 0.89 | 0.86–0.92 | Pearson correlation |
| TPS ≥50% sensitivity | 91.4% | 86.8–94.8% | Consensus positive (n=105) |
| TPS ≥50% specificity | 94.1% | 90.2–96.8% | Consensus negative (n=185) |
Evaluate PD-L1 Scoring on Your Cases
Submit de-identified NSCLC or gastric cancer WSI with assay metadata for a pilot scoring report.